Section 7.1 · Topic 6 of 10
7.1.6 The dispersion relation and the ω–τ diagram
Rewrite with and , where :
In the – plane every mode is a hyperbola. It starts at with and approaches the light line of the filling, which is the TEM wave.
Reading the diagram. At an operating point on a mode curve, is the slope of the line from the origin to the point, and is the slope of the tangent there (Figure 7.1.6). Every mode curve lies above the light line, so the line from the origin is steeper than the light line and the tangent is less steep: whenever .
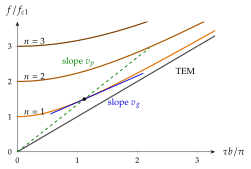
The tool below draws the same diagram, with in place of , for the simplest guide, the air-filled parallel-plate guide of Section 7.2, here with and the operating point . Change and watch the secant () and the tangent () follow the dot along the TM curve.